Output summary files
SnpEff creates an additional output file showing overall statistics. This "stats" file is an HTML file which can be opened using a web browser. It can also be created as a CSV file, for easier parsing or manipulation. You can find an example of a 'stats' file here.
Summary file options
By default, SnpEff performs some statistics and saves them to the snpEff_summary.html on the same directory where snpEff is being executed.
You can see the file, by opening it in your browser. SnpEff also creates a "Genes Statistics" file (snpEff_genes.txt) with gene-level statistics in tabular (tab-separated) format.
There are some command line options related to the statistics:
-stats <file>: You can change the default name and location of the HTML file. This also changes the name and location of the "genes" (TXT) file.-noStats: Do not calculate statisticsm, or create stats (summary) files-csvStats <file>: Create the statistics file in CSV format with the specified name.
Info
The "Genes statistics" file path is by default the directory where SnpEff is executed and called snpEff_genes.txt. If you change the summary file name / path by either using -stats or csvStats command line, the "Genes statistics" file path will be the same directory as the summary file and the file name is the same "base name" plus a ".genes.txt".
Summary report
The summary report consist of several sections:
- Main summary table
- Variant rate by chromosome: A table of number of variants and variants rate per chromosome
- Variants by type
- Number of variants by impact: A count and percentage of variants by impact
- Number of variants by functional class: A count and percentage of variants by functional class
- Number of variants by annotation
- Quality histogram: Variant Quality histogram, i.e. a histogram of the VCF's
QUALfield - InDel length histogram: Length of
INSandDELvariants - Base variant table: Table of SNV variants changes
- Transition vs transversions (ts/tv): Transition vs transversions table, split into "known" and all variants (known variants are the ones with non-empty
IDfield). - Allele frequency: Allele frequency histogram
- Allele Count: Allele count histogram
- Codon change table: A table of all codon changes counts
- Amino acid change table: A table of all amino acid changes counts
- Chromosome variants plots: Plots of number of variants for each chromosome location
- Details by gene: Link to "Genes Statistics" file
Main summary table
The main summary table contains basic information about the SnpEff run and some overall statistics:
| Table Entry | Note |
|---|---|
| Genome | Genome name and version, as specified in the command line |
| Date | Date and time when the analysis was performed |
| SnpEff version | SnpEff version |
| Command line arguments | Command line arguments and options used to annotate |
| Warnings | Number of WARNING annotation messages (i.e. WARNING messages in the ANN field) |
| Errors | Number of ERROR annotation messages (i.e. ERROR messages in the ANN field) |
| Number of lines (input file) | Number of lines in the input file, excluding comment / header lines |
| Number of variants (before filter) | Number of variants in the input file. Note that this can differ from the number of lines; e.g. VCF allows for multiple variants per line and IUPAC expansion. |
| Number of not variants | Number of non-variants, e.g. if the REF and ALT fields are the same |
| Number of variants processed | Number of variants processed. This can be different than the number of variants due to filtering and non-variants entries. |
| Number of known variants | Variants that have a non-empty ID field. |
| Number of multi-allelic VCF entries | Variants that have mode then two alleles. Most variants have only two alleles: REF and one ALT. Multi-allelic variants have multiple ALT entries. |
| Number of annotations | Total number of variant annotations. Note that this is typically higher than the number of variant |
| Genome total length | Total genome length (in bases) |
| Genome effective length | Total length of the chromosomes (in bases). This only counts chromosomes that had varinats |
| Variant rate | Number of variants per genomic length: Number of variants / Genome effeective length |
Warning
The number of input lines, number of variants, and number of annotation are different counts and typically are not equal, see details in this FAQ
Variants by type
This table contains a list of the number of variants, grouped by variant type:
| Type | Note |
|---|---|
SNP |
SNP / SNV is a single nucleotide variant, e.g. 'A -> G' |
MNP |
MNP / MNV is a multiple nucleotide variant, e.g. 'AC -> GT' |
INS |
Insertion, e.g. 'A -> AT' |
DEL |
Deletion, e.g. 'AT -> A' |
MIXED |
A mixed vairant is a combination of SNP / MNP / INS / DEL, for example ' |
INV |
An inversion of reference sequence |
DUP |
A duplication is a region of elevated copy number relative to the reference |
BND |
An arbitrary rearrangement |
INTERVAL |
An interval marke, e.g. an interval from a BED file |
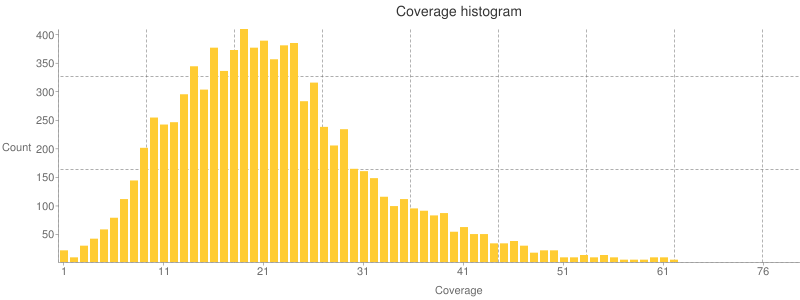
Histograms
E.g.: In the stats file, you can see coverage histogram plots like this one:

Annotations & Region
SnpEff annotates variants using "functional annotaions", e.g. NON_SYNONYMOUS_CODING, STOP_GAINED, etc..
These variants affect regions of the genome (e.g. EXON, INTRON).
The two tables count how many effects for each type and for each region exists.
E.g.: In an EXON region, you can have all the following effect types: NON_SYNONYMOUS_CODING, SYNONYMOUS_CODING, FRAME_SHIFT, STOP_GAINED, etc.
The complicated part is that some annotaitons affect a region that has the same name (yes, I know, this is confusing).
E.g.: In a UTR_5_PRIME region you can have UTR_5_PRIME and START_GAINED effect type.
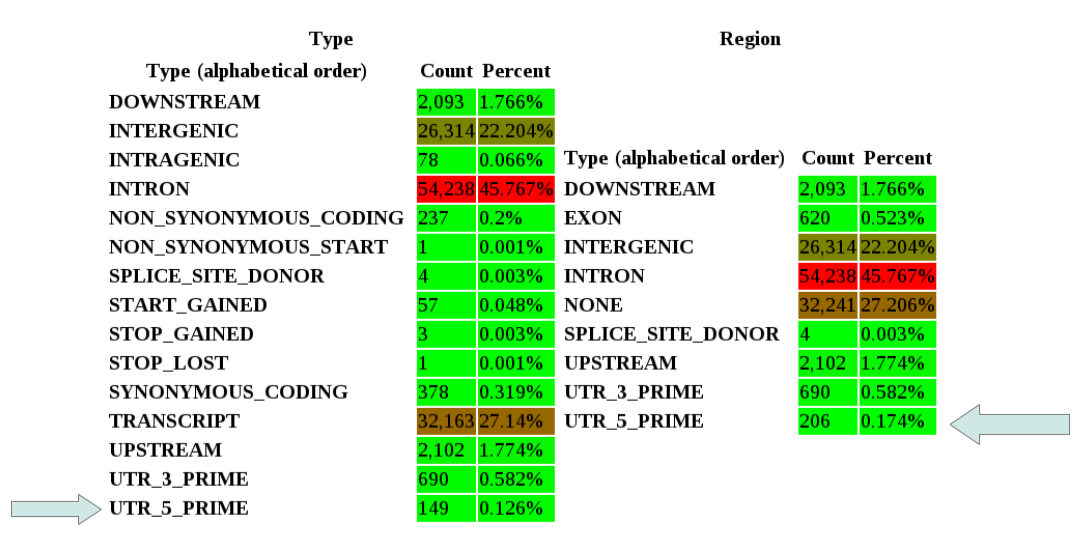
This means that the number of both tables are not exactly the same, because the labels don't mean the same. See the next figure as an example:

So the number of effects that affect a UTR_5_PRIME region is 206. Of those, 57 are effects type START_GAINED and 149 are effects type UTR_5_PRIME.
How exactly are effect type and effect region related? See the following table:
| Effect Type | Region |
|---|---|
NONE, CHROMOSOME, CUSTOM, CDS |
NONE |
INTERGENIC, INTERGENIC_CONSERVED |
INTERGENIC |
UPSTREAM |
UPSTREAM |
UTR_5_PRIME, UTR_5_DELETED, START_GAINED |
UTR_5_PRIME |
SPLICE_SITE_ACCEPTOR |
SPLICE_SITE_ACCEPTOR |
SPLICE_SITE_DONOR |
SPLICE_SITE_DONOR |
SPLICE_SITE_REGION |
SPLICE_SITE_REGION |
INTRAGENIC, START_LOST, SYNONYMOUS_START, NON_SYNONYMOUS_START, GENE, TRANSCRIPT |
EXON or NONE |
EXON, EXON_DELETED, NON_SYNONYMOUS_CODING, SYNONYMOUS_CODING, FRAME_SHIFT, CODON_CHANGE, CODON_INSERTION, CODON_CHANGE_PLUS_CODON_INSERTION, CODON_DELETION, CODON_CHANGE_PLUS_CODON_DELETION, STOP_GAINED, SYNONYMOUS_STOP, STOP_LOST, RARE_AMINO_ACID |
EXON |
INTRON, INTRON_CONSERVED |
INTRON |
UTR_3_PRIME, UTR_3_DELETED |
UTR_3_PRIME |
DOWNSTREAM |
DOWNSTREAM |
REGULATION |
REGULATION |
Gene statistics
SnpEff also generates a TXT (tab separated) file having counts of number of variants affecting each transcript and gene.
By default, the file name is snpEff_genes.txt, but it can be changed using the -stats command line option.
Here is an example of this file:
$ head snpEff_genes.txt
# The following table is formatted as tab separated values.
#GeneName   GeneId  TranscriptId    BioType variants_impact_HIGH    variants_impact_LOW variants_impact_MODERATE    variants_impact_MODIFIER    variants_effect_3_prime_UTR_variant variants_effect_5_prime_UTR_premature_start_codon_gain_variant  variants_effect_5_prime_UTR_variant variants_effect_downstream_gene_variant variants_effect_intron_variant  variants_effect_missense_variant    variants_effect_non_coding_exon_variant variants_effect_splice_acceptor_variant variants_effect_splice_donor_variant    variants_effect_splice_region_variant   variants_effect_start_lost  variants_effect_stop_gained variants_effect_stop_lost   variants_effect_synonymous_variant  variants_effect_upstream_gene_variant   bases_affected_DOWNSTREAM   total_score_DOWNSTREAM  length_DOWNSTREAM   bases_affected_EXON total_score_EXON    length_EXON bases_affected_INTRON   total_score_INTRON  length_INTRON   bases_affected_SPLICE_SITE_ACCEPTOR total_score_SPLICE_SITE_ACCEPTOR    length_SPLICE_SITE_ACCEPTOR bases_affected_SPLICE_SITE_DONOR    total_score_SPLICE_SITE_DONOR   length_SPLICE_SITE_DONOR    bases_affected_SPLICE_SITE_REGION   total_score_SPLICE_SITE_REGION  length_SPLICE_SITE_REGION   bases_affected_TRANSCRIPT   total_score_TRANSCRIPT  length_TRANSCRIPT   bases_affected_UPSTREAM total_score_UPSTREAM    length_UPSTREAM bases_affected_UTR_3_PRIME  total_score_UTR_3_PRIME length_UTR_3_PRIME  bases_affected_UTR_5_PRIME  total_score_UTR_5_PRIME length_UTR_5_PRIME
AC000029.1  ENSG00000221069 ENST00000408142 miRNA   0   0   0   2   0   0   0   2   0   0   0   0   0   0   0   0   5000    0   0   0   0   0   0   0   0   0   0   0   0   0   0   0   0   0   0   0   0   0   0   0
AC000068.5  ENSG00000185065 ENST00000431090 antisense   0   0   0   1   0   0   0   0   0   0   0   0   0   0   0   5000    0   0   0   0   0   0
AC000081.2  ENSG00000230194 ENST00000433141 processed_pseudogene    0   0   0   8   0   0   0   3   0   0   0   0   0   0   5000    0   0   0   0   0   0   0   0   0   0   0   0   0   0   0   0   0   0   5   0   5000    0   0
AC000089.3  ENSG00000235776 ENST00000424559 processed_pseudogene    0   0   0   1   0   0   0   0   0   0   0   0   0   0   5000    0   0   0   0   0   0
AC002472.1  ENSG00000269103 ENST00000547793 protein_coding  0   0   0   6   0   0   0   5   0   0   0   0   0   0   0   5000    0   0   0   0   0   0   0   0   0   0   0   0   0   0   0   0   0   0   1   0   5000    0   0
AC002472.11 ENSG00000226872 ENST00000450652 antisense   0   0   0   13  0   0   0   5   2   0   0   0   0   0   0   5000    0   0   0   2   0   11199   0   0   0   0   0   0   0   0   0   0   0   0   6   0   5000    0   0
AC002472.13 ENSG00000187905 ENST00000342608 protein_coding  0   1   6   1   0   0   0   0   1   6   0   0   0   1   0   116 1   0   934 0   0   0   0   0   0   1   0   3   0   0   0   0   0   0   0   0   0   0   0
AC002472.13 ENSG00000187905 ENST00000442047 protein_coding  0   1   6   1   0   0   0   0   1   6   0   0   0   1   0   116 1   0   934 0   0   0   0   0   0   1   0   3   0   0   0   0   0   0   0   0   0   0   0
The columns in this table are:
| Column name | Meaning |
|---|---|
| GeneName | Gene name (usually HUGO) |
| GeneId | Gene's ID |
| TranscriptId | Transcript's ID |
| BioType | Transcript's bio-type (if available) |
| The following column is repeated for each impact {HIGH, MODERATE, LOW, MODIFIER} | |
| variants_impact_* | Count number of variants for each impact category |
| The following column is repeated for each annotated effect (e.g. missense_variant, synonymous_variant, stop_lost, etc.) | |
| variants_effect_* | Count number of variants for each effect type |
| The following columns are repeated for several genomic regions (DOWNSTREAM, EXON, INTRON, UPSTREAM, etc.) | |
| bases_affected_* | Number of bases that variants overlap genomic region |
| total_score_* | Sum of scores overlapping this genomic region. Note: Scores are only available when input files are type 'BED' (e.g. when annotating ChipSeq experiments) |
| length_* | Genomic region length |